
About Me
I am a passionate software engineering graduate from AIUB, with a strong focus on the data-driven landscape. My journey in the tech world has ignited a profound interest in data analysis, data engineering, and business intelligence. With nearly a year of dedicated learning, I have completed over 10 certifications including the prestigious "Microsoft Power BI Data Analyst Specialization." My dedication to learning extends to hands-on projects—over 10 personal data-driven initiatives—that showcase my ability to tackle real-world challenges with tools like Power BI, SQL, Excel, and Python.
I have hands-on experience in ETL processes, data modeling, database management and visualization. My knowledge extends to DAX, SQL, and larger datasets, with ongoing preparation for the Microsoft PL-300 Data Analyst certification. To regularly enhance my data driven skills i'm practicing through platforms like DataCamp, Maven Analytics and HackerRank. I am also familiar with the Software Development Life Cycle (SDLC) and Unified Modeling Language (UML), which enhances my ability to collaborate effectively within teams and manage projects efficiently.
During my undergraduate studies, I explored courses like Advanced Database Management Systems, Statistics and Probability and Artificial Intelligence, gaining insights into business intelligence, product management, and software quality assurance.
As an aspiring data enthusiast, I am eager to contribute to innovative projects that challenge my technical skills while making a meaningful impact on businesses. My goal is to work in an environment that fosters learning and innovation, where I can help organizations leverage data for better decision-making and drive efficiency across various industries.
Skills
BI Method
Power Query
ETL
EDA
DAX
Excel Pivot Tables
Data Analysis
Database Management
Dashboard
Visualization
Visualization
Power BI
Microsoft Excel
Looker Studio
Programming Languages
SQL
Python
HTML
Database
PostgreSQL
Oracle
MySQL
MSSQL
Cloud Data Platform
BigQuery
snowflake
Version Control
Git
GitHub
Project Management Tool
ClickUp
Jira
Trello
Miscellaneous
Statistics
AI
IoT
Agile
SDLC
RDBMS
Data Analysis
Dashboard
Manual Testing
UML Diagram
Canva
Filmora
Certifications

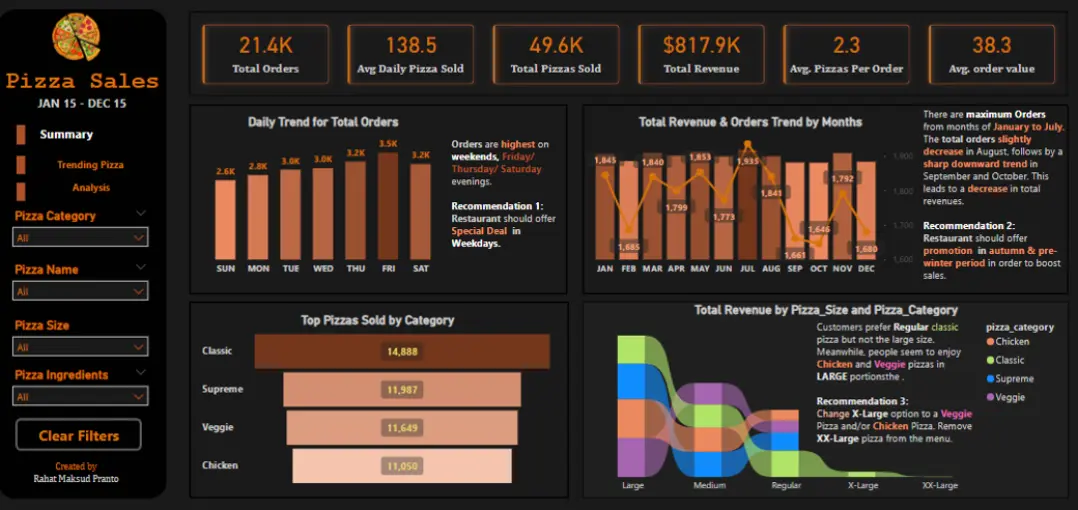
Projects
- All
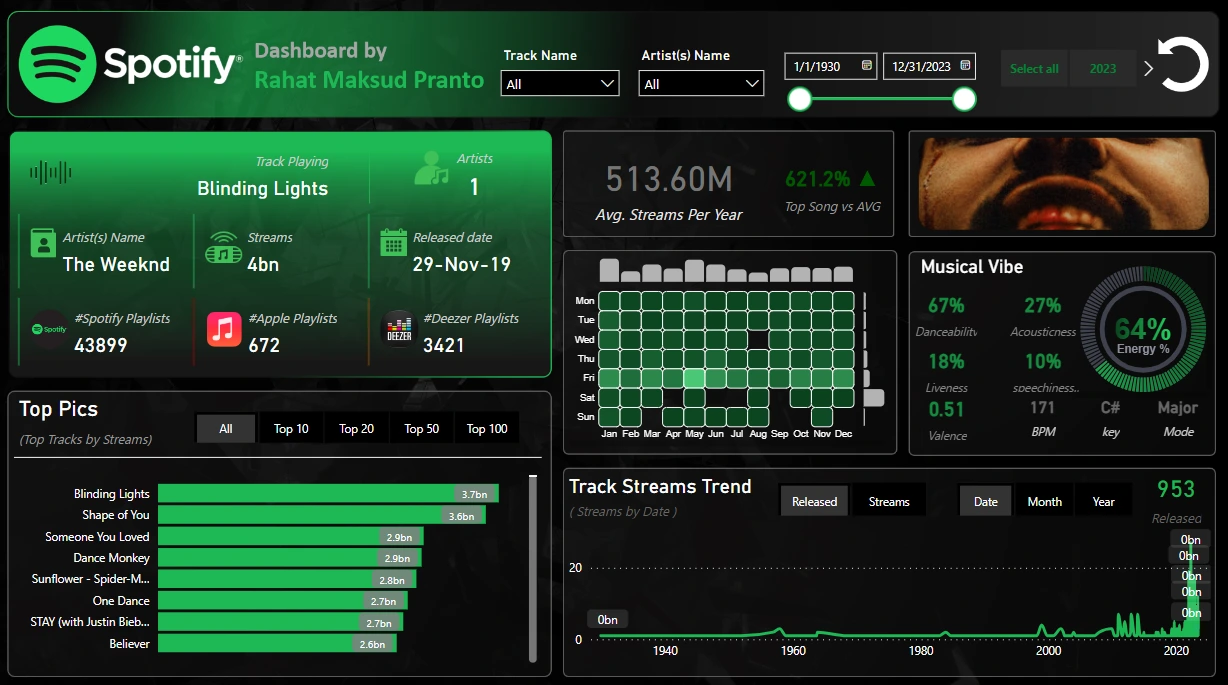
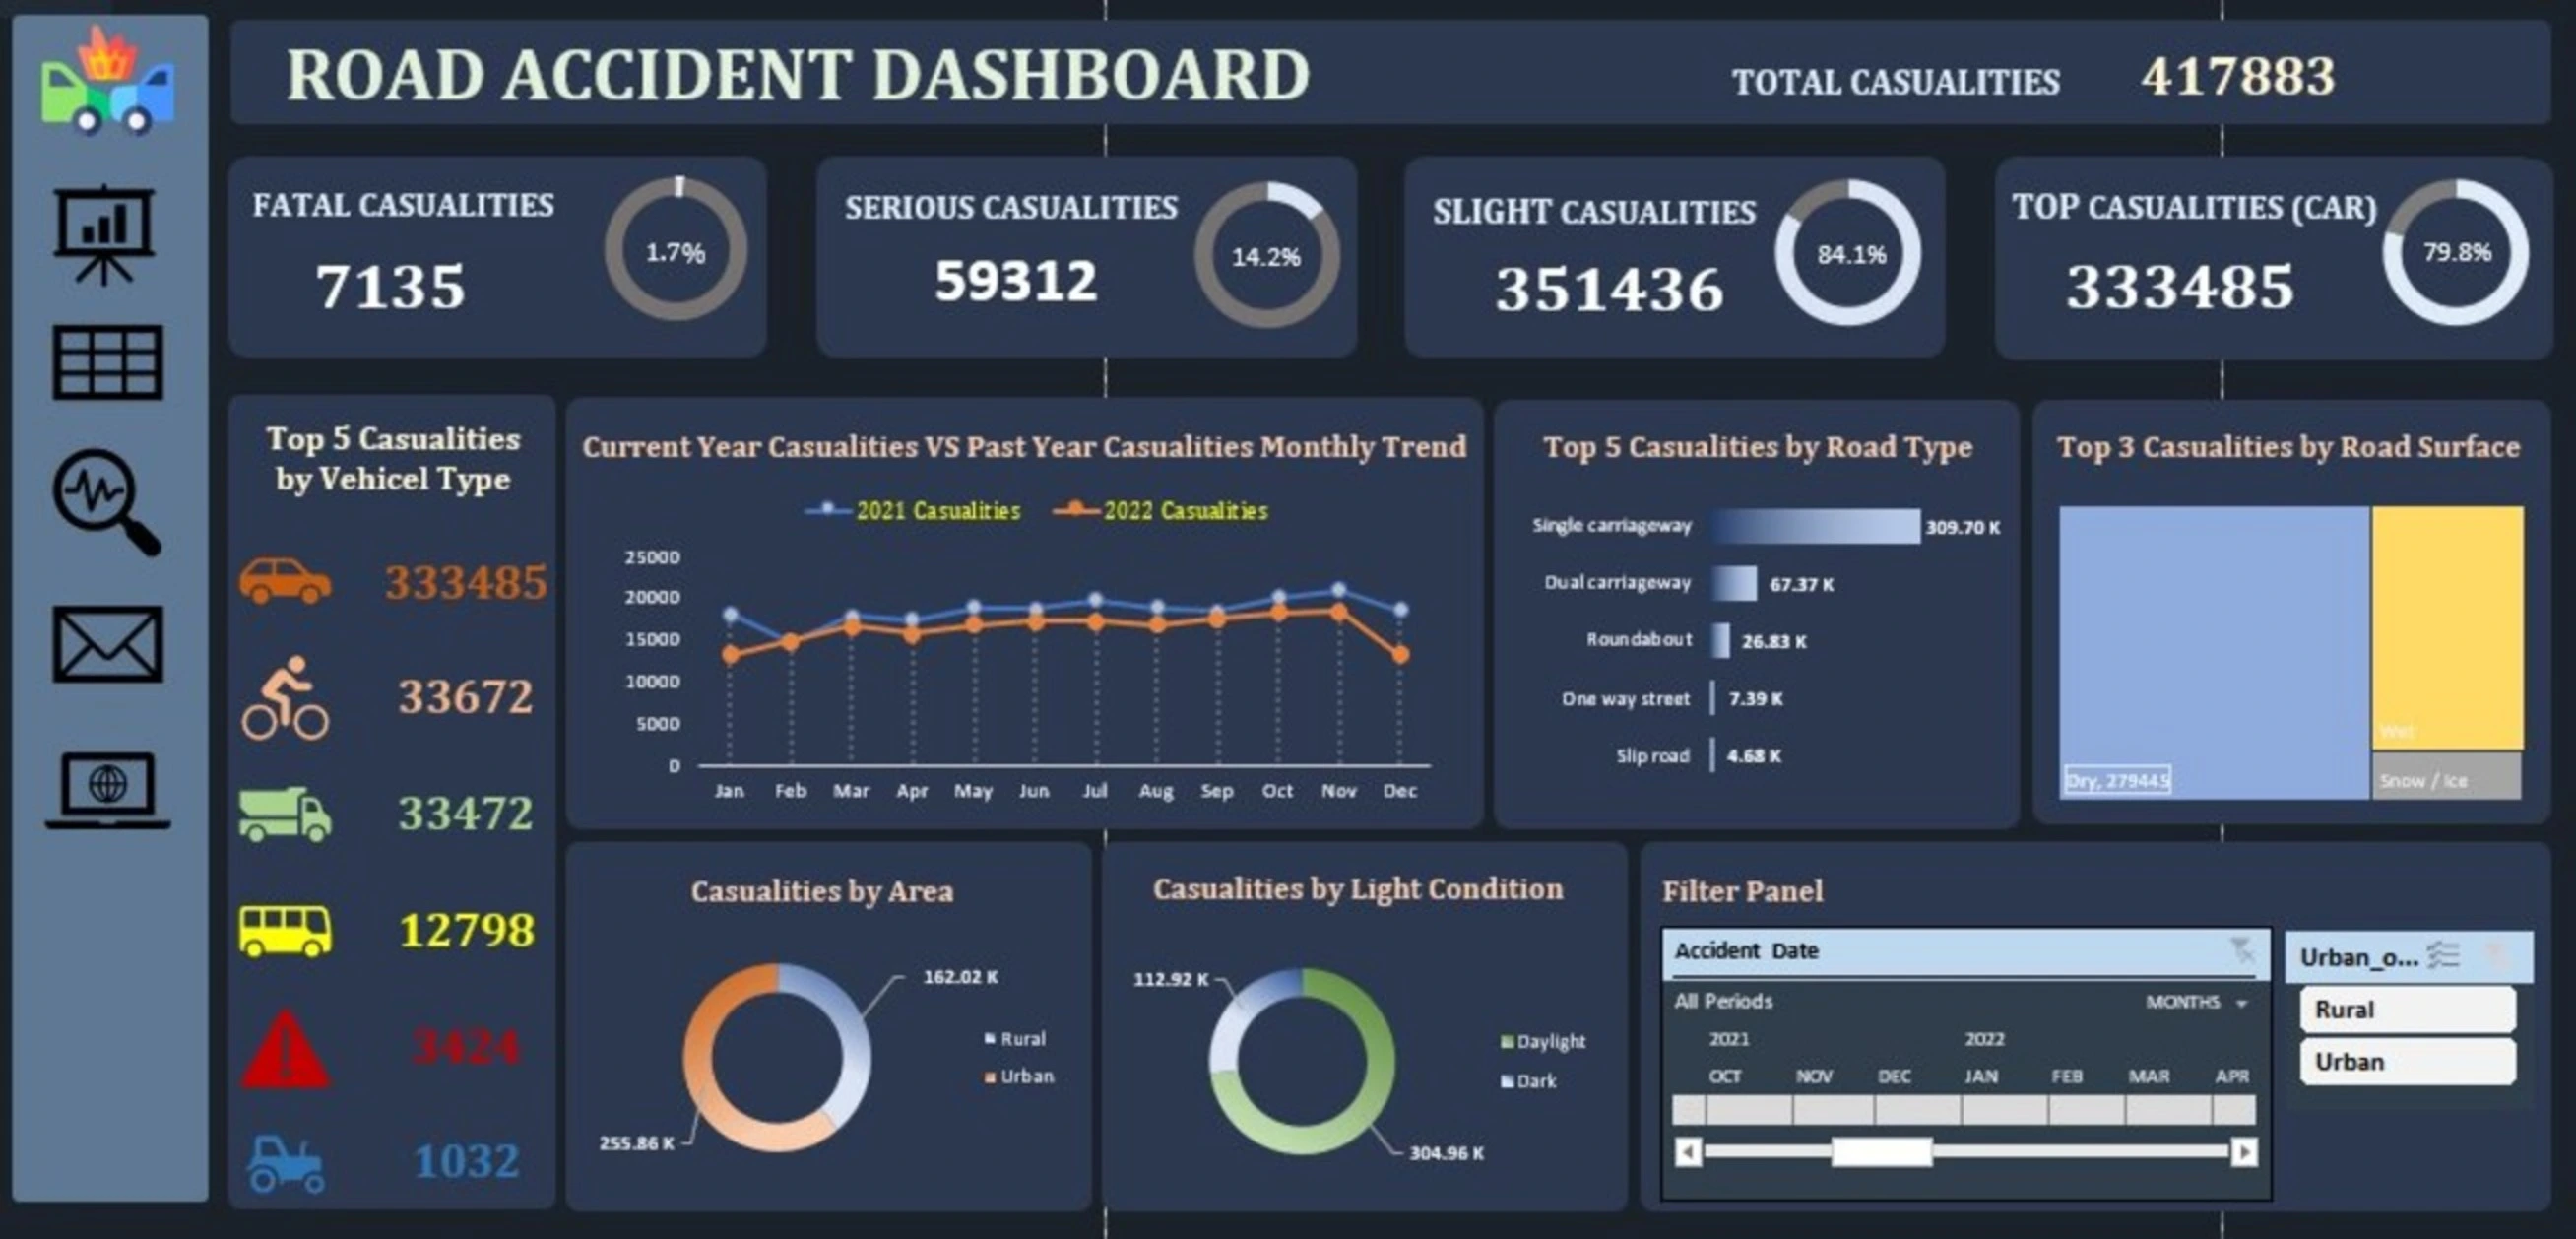
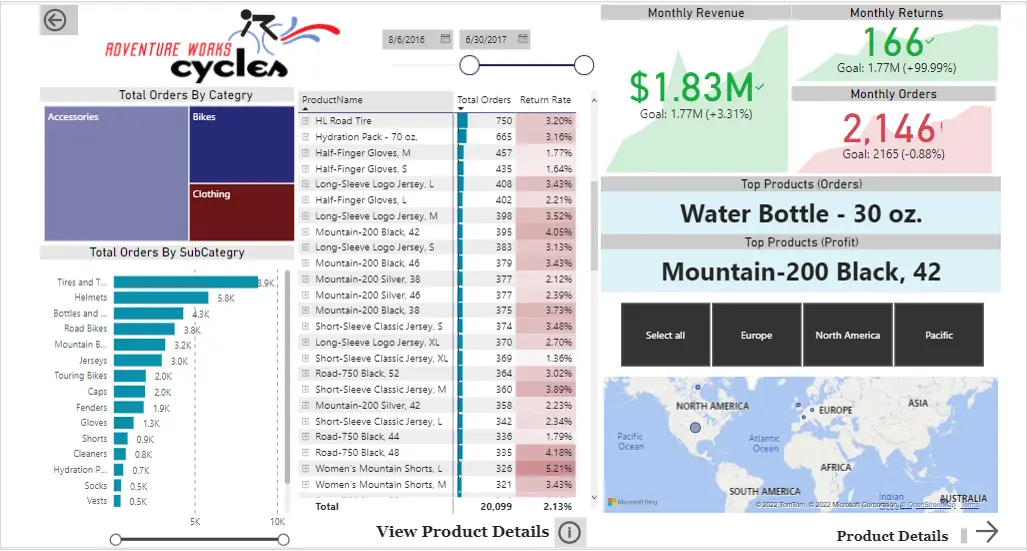
- Power BI Dashboard
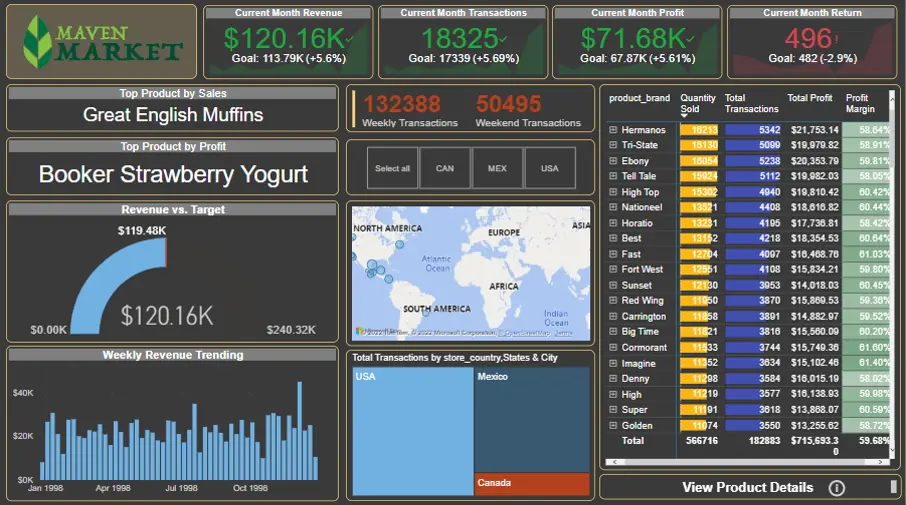
- Excel Dashboard
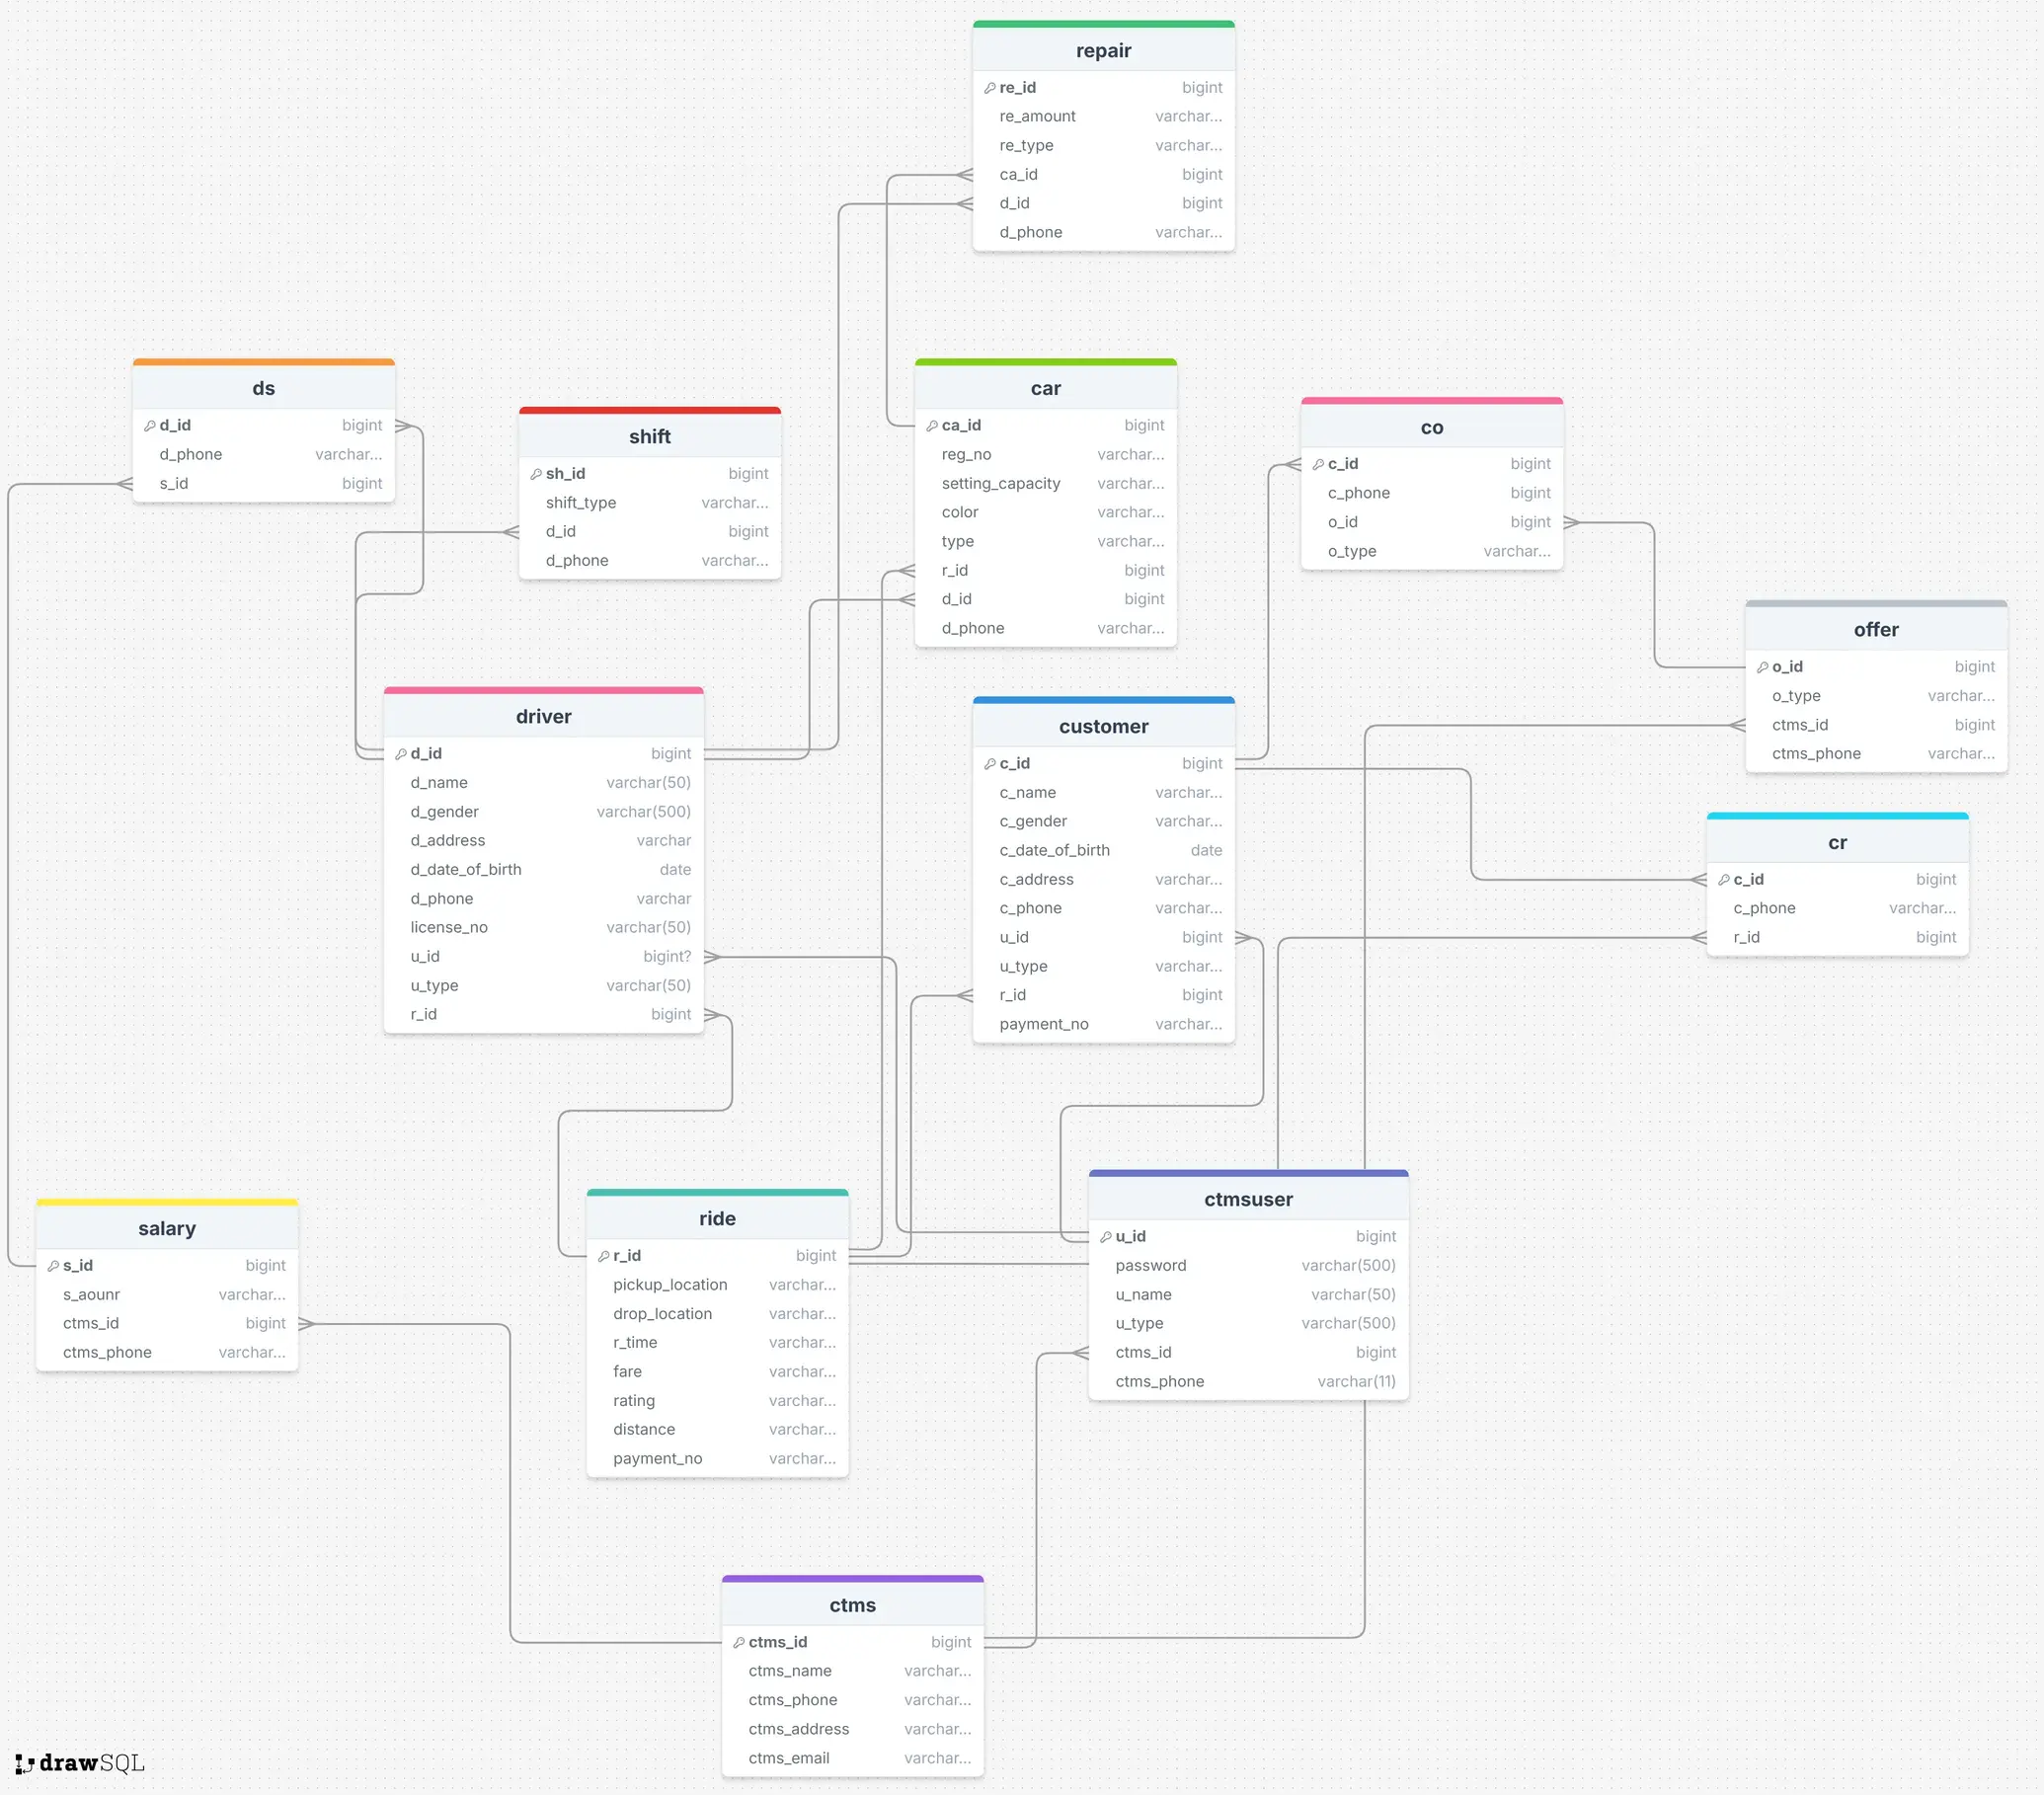
- SQL
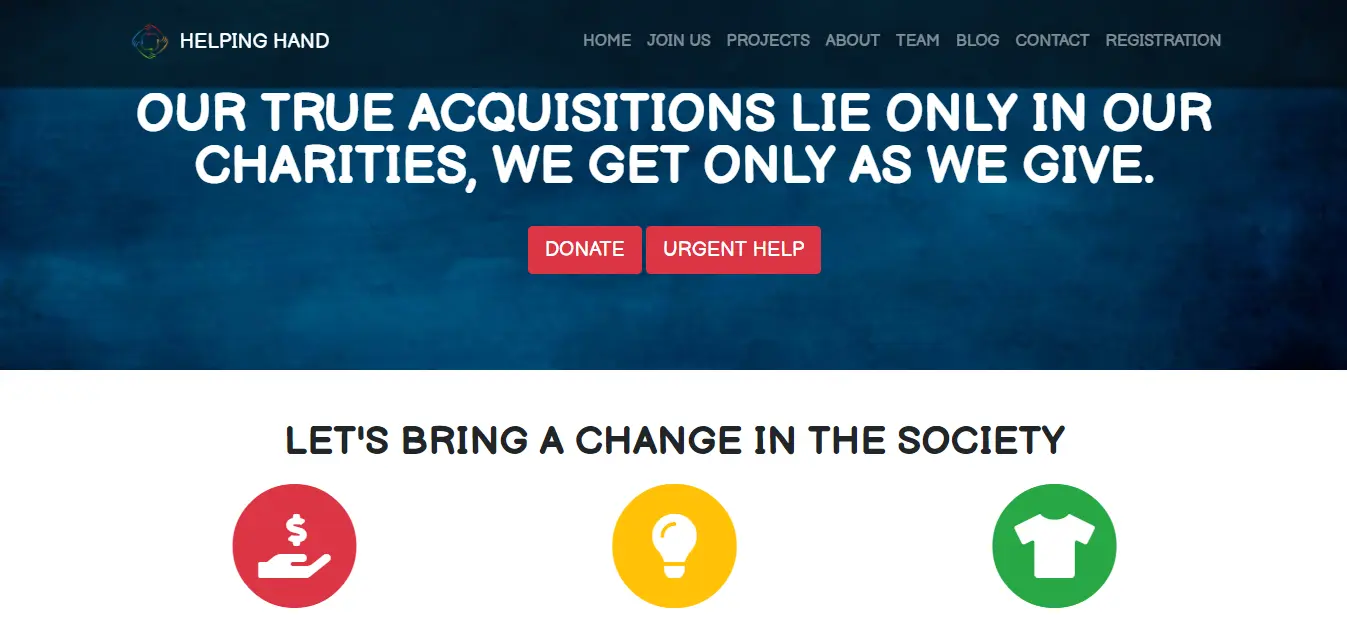
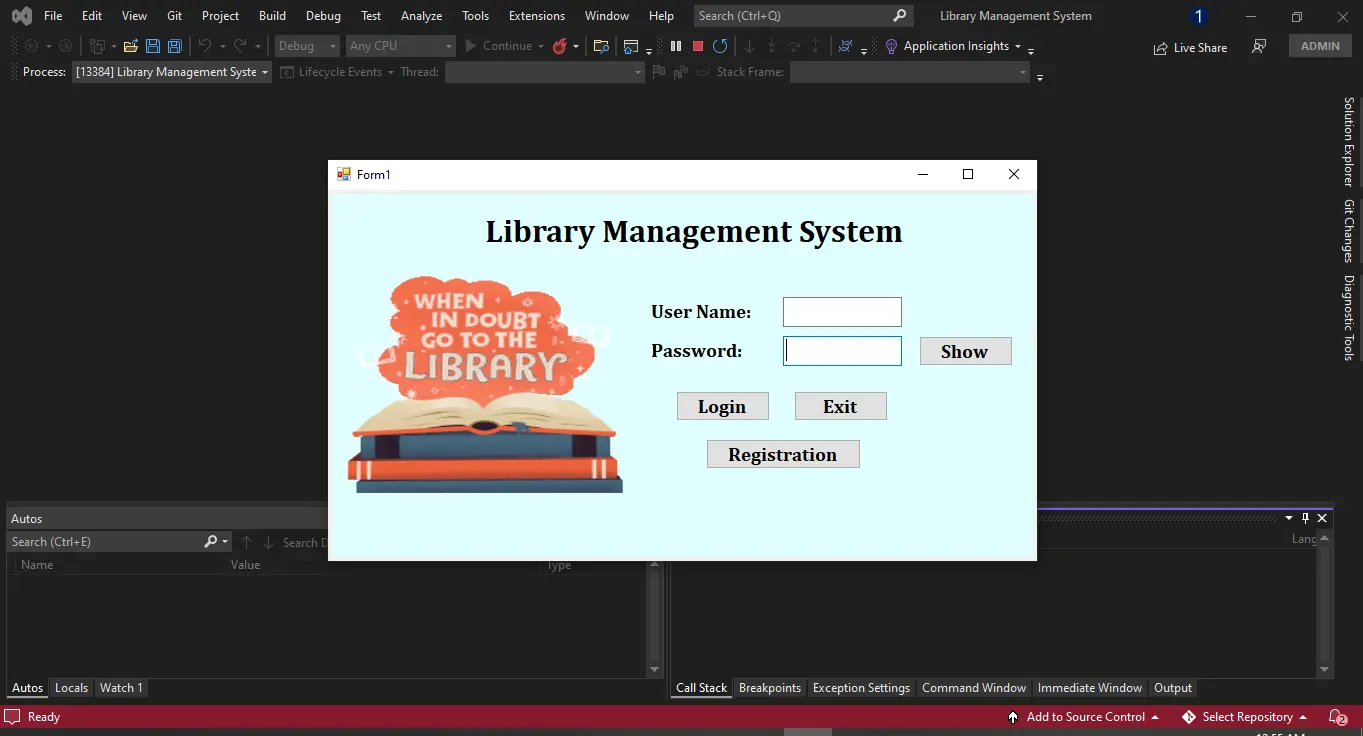
- Software
Profile
Work Experience
Junior Data Analyst
V2 Technologies Ltd. Aug 2025 - Present- Developing advanced business intelligence dashboards and reports using SQL, BigQuery and Looker Studio.
- Improved campaign decision-making by delivering actionable data insights from advanced dashboards.
- Collaborating with cross-functional teams to identify and solve data-related challenges.
- Participating in data quality improvement and ETL pipeline enhancements.
Data Analyst Intern
V2 Technologies Ltd. Feb 2025 - Aug 2025- Assigned to BAT E-CRM project; created 15+ daily campaign, call check-back, and live observation reports using SQL.
- Built 5+ interactive Looker dashboards to track campaign KPIs, enhancing visibility into customer engagement.
- Developed ad hoc reports using advanced SQL on cleaned, structured data to support fast decision-making.
Teacher Assistant
American International University-Bangladesh (AIUB) Jan 2022 - Apr 2022- Assisted the course teacher in completing 97% of lesson plans on time.
- Guided 40 students in database concepts, enhancing understanding and improv SQL assignment performance.
- Debugged over 100+ SQL queries and lab assignments in Oracle.
Education
B Sc. in Computer Science & Software Engineering
American International University-Bangladesh (AIUB) 2018 - 2023Higher Secondary Certificate
Govt. Ananda Mohan College, Mymensingh 2015 - 2017 |ScienceSecondary School Certificate
Mymensingh Zilla School 2007 - 2015 | ScienceAcademic Research
Smart Irrigation System Using IOT (Thesis)
International Journal of Information Technology Convergence and Services (Under Review) 2023Extracurricular Activities
143rd National School Handball Champion
Mymensingh Zilla School 2012Founder Executive Member
MZS Ex-Students Sports Club Dec 2020 - Present- Planned and managed events for the club as a core member.
Get in Touch
I'd love to hear from you! Fill out the form below to send me a message.