POWER BI DASHBOARD
Pizza Sales Dashboard
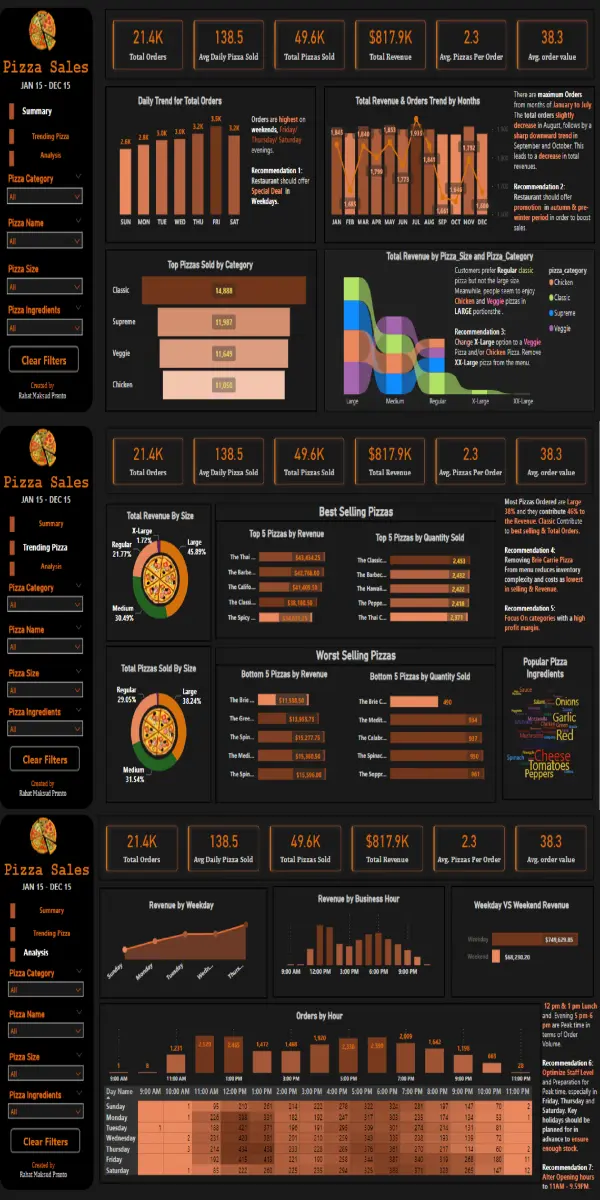
End-to-end business intelligence dashboard analyzing pizza sales performance, customer behavior, and operational efficiency using SQL and Power BI.
Project Overview
Conducted a comprehensive pizza sales analysis as part of the Maven Analytics challenge, acting as a Business Intelligence Consultant for a Greek-inspired pizza restaurant in New Jersey. The project focused on leveraging data analytics to enhance operational efficiency, optimize inventory and labor management, and drive revenue growth through actionable insights.
Objectives
- Analyze 50,000+ sales records to identify customer demand patterns and operational bottlenecks.
- Develop an end-to-end ETL process to transform raw sales data into meaningful insights.
- Build an interactive Power BI dashboard with key performance indicators (KPIs).
- Address critical business questions related to peak hours, product performance, and inventory management.
- Provide data-driven recommendations to improve operational efficiency and profitability.
My Responsibilities
- Designed and implemented ETL pipelines using Power Query and MSSQL for data extraction, cleaning, and transformation.
- Developed advanced DAX measures in Microsoft Power BI to calculate KPIs and performance metrics.
- Built a dynamic dashboard featuring 15+ KPIs, including sales trends, peak hours, product performance, and average order value.
- Analyzed peak demand periods and sales distribution by day and time.
- Identified best- and worst-performing products to support inventory optimization.
- Delivered strategic recommendations based on data-driven findings.
Key Insights
- Peak Hours: Highest order volume occurs at 12 PM–1 PM (lunch) and 5 PM–6 PM (evening).
- Busiest Days: Thursdays, Fridays, and Saturdays generate the highest sales volume.
- Production Spike: On Thursdays at noon alone, approximately 2,520 pizzas are produced.
- Top Performer: Classic Deluxe Pizza is the best-selling item.
- Lowest Performer: Brie Carre Pizza has the lowest sales volume.
- Average Order Value (AOV): Approximately $38.30 per order.
Impact
- Proposed 7 strategic operational improvements targeting inventory optimization, labor allocation, and service efficiency.
- Recommendations projected to increase overall revenue by approximately 3%.
- Enabled data-driven decision-making through real-time KPI monitoring and performance tracking.
- Improved operational planning by identifying demand trends and peak production periods.