POWER BI DASHBOARD
Pizza Sales Dashboard
End-to-end business intelligence dashboard analyzing pizza sales performance, customer behavior, and operational efficiency using SQL and Power BI.
Project Overview
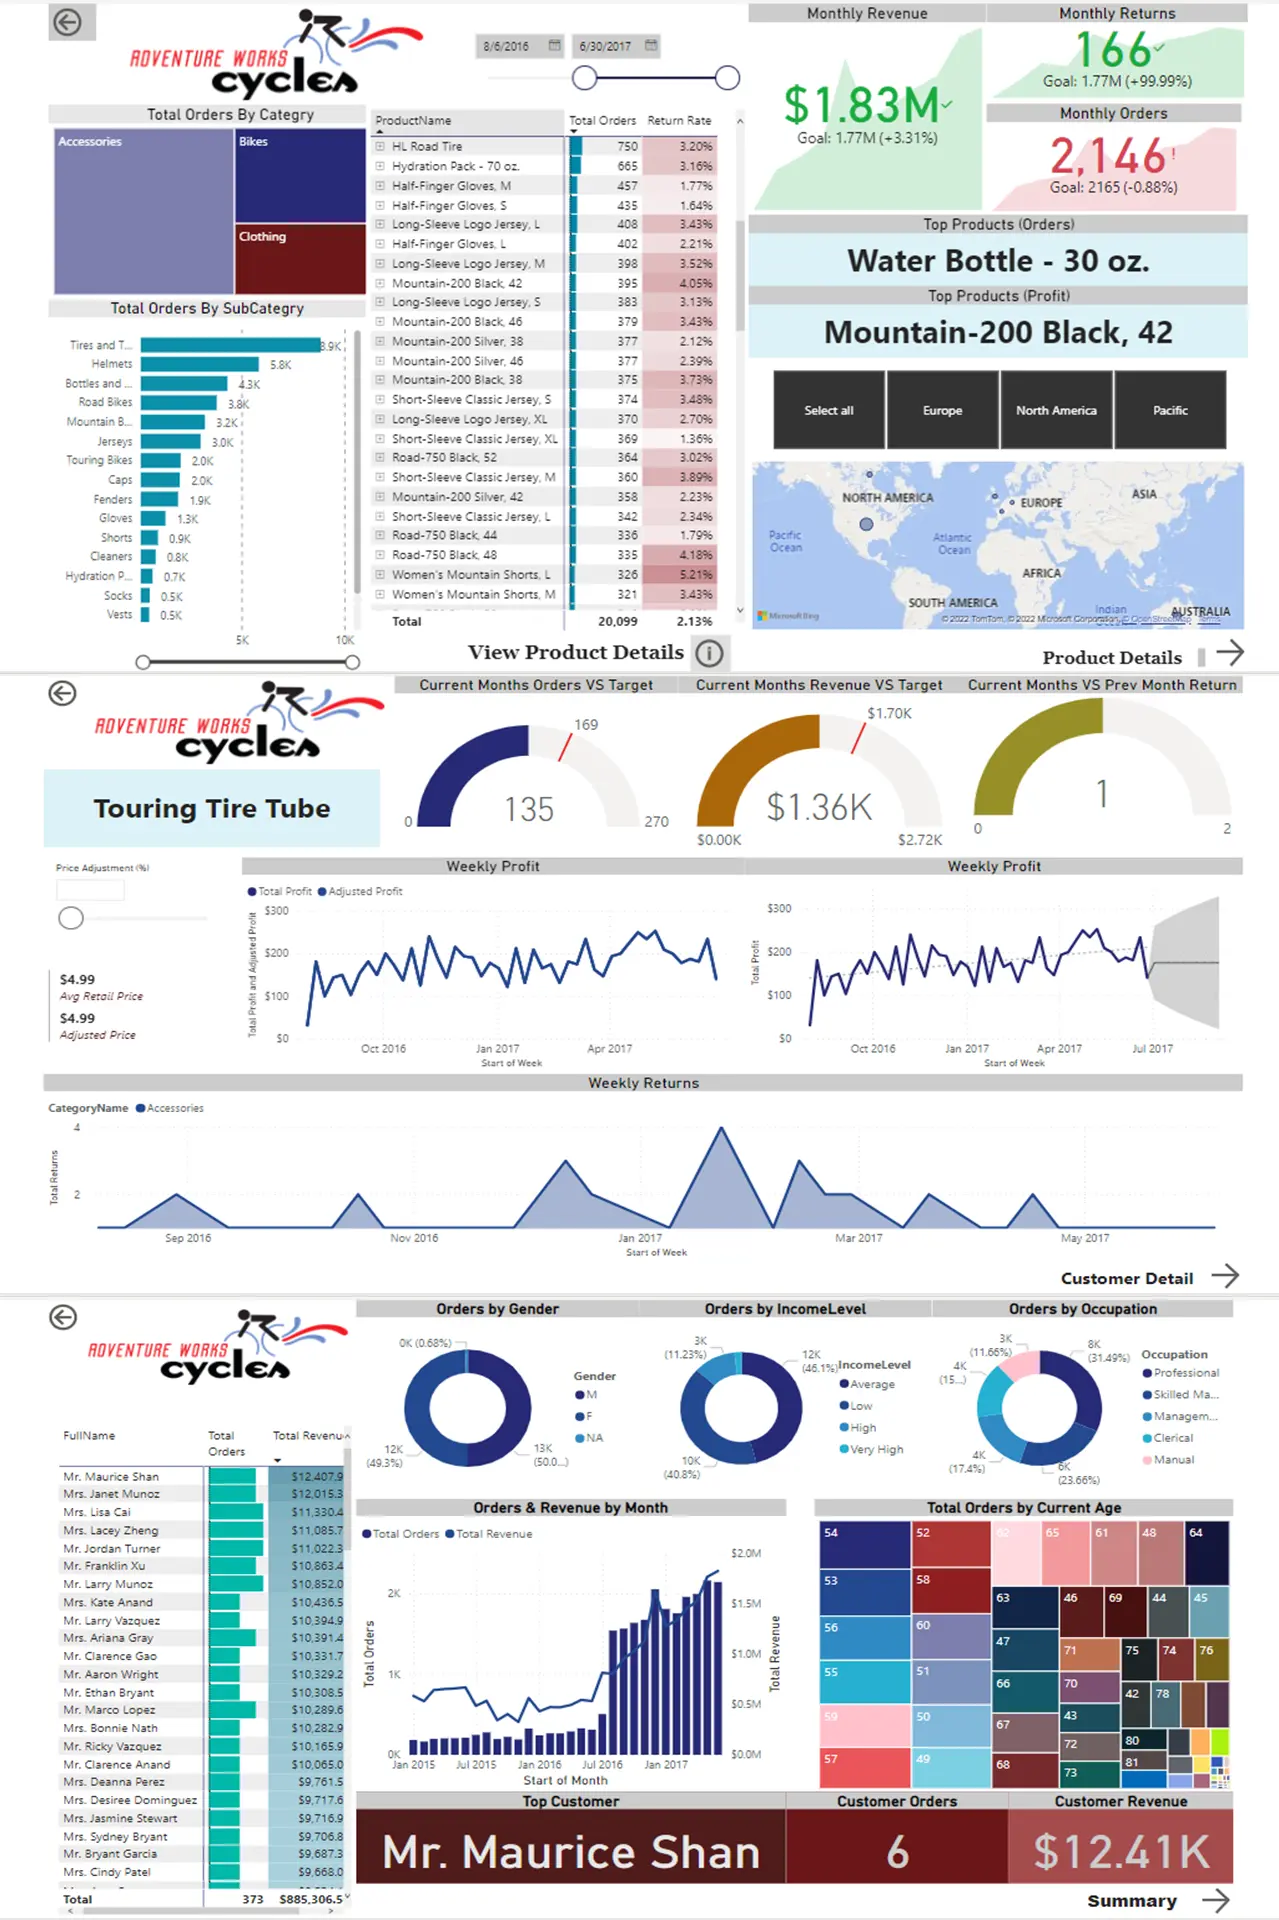
Completed a certification project as part of the “Microsoft Power BI Desktop for Business Intelligence” course on Udemy, where I assumed the role of a Business Intelligence Analyst for the fictional company AdventureWorks Cycles. The project focused on transforming raw datasets into professional-quality reports and dashboards through data preparation, modeling, analysis, and visualization.
Objectives
- Develop a complete end-to-end business intelligence solution.
- Transform raw data into structured, analysis-ready datasets.
- Design interactive dashboards to monitor business performance.
- Track and analyze key performance indicators (KPIs).
My Responsibilities
- Performed data cleaning, transformation, and modeling using Power BI.
- Built a robust data model with relationships between fact and dimension tables.
- Created advanced DAX measures to track KPIs including Revenue, Sales, Profit, and Returns.
- Designed an interactive AdventureWorks dashboard incorporating AI-powered visuals.
- Conducted exploratory data analysis to identify regional and product-level performance trends.
- Generated forecasts to support strategic decision-making.
Key Insights
- Developed a complete end-to-end BI workflow from raw data to executive dashboard.
- Tracked core KPIs such as Revenue, Sales, Profit, and Return rates.
- Compared regional sales performance to identify high- and low-performing markets.
- Analyzed product-level trends to support inventory and sales strategies.
- Utilized AI visuals for deeper insights and automated trend detection.
Impact
- Strengthened practical expertise in business intelligence and analytics.
- Gained hands-on experience working with real-world business scenarios.
- Improved dashboard design, KPI tracking, and data storytelling capabilities.