EXCEL DASHBOARD
Road Accident Dashboard
Interactive Excel dashboard analyzing road accident patterns, casualties, and risk factors across different locations, weather conditions, and vehicle types for data-driven road safety decisions.
Project Overview
Developed a personal project titled "Road Accident Dashboard" using Microsoft Excel to analyze road accident data and uncover patterns that could enhance road safety. The project focused on transforming raw accident data into meaningful insights to support traffic management improvements and accident prevention strategies.
Objectives
- Analyze road accident data to identify trends and risk factors.
- Understand casualty distribution by vehicle type, road type, and surface condition.
- Create an interactive Excel dashboard for dynamic data exploration.
- Provide data-driven insights to support road safety improvements.
My Responsibilities
- Conducted requirement gathering to understand stakeholder needs and reporting expectations.
- Identified key stakeholders and defined project scope.
- Performed data cleaning to remove inconsistencies, errors, and duplicate records.
- Processed data by creating calculated columns for efficient sorting, filtering, and categorization.
- Applied statistical analysis techniques to extract meaningful insights from the dataset.
- Designed charts, graphs, and interactive visuals using Excel.
- Built a dynamic dashboard incorporating slicers and timelines for enhanced user interactivity.
Key Insights
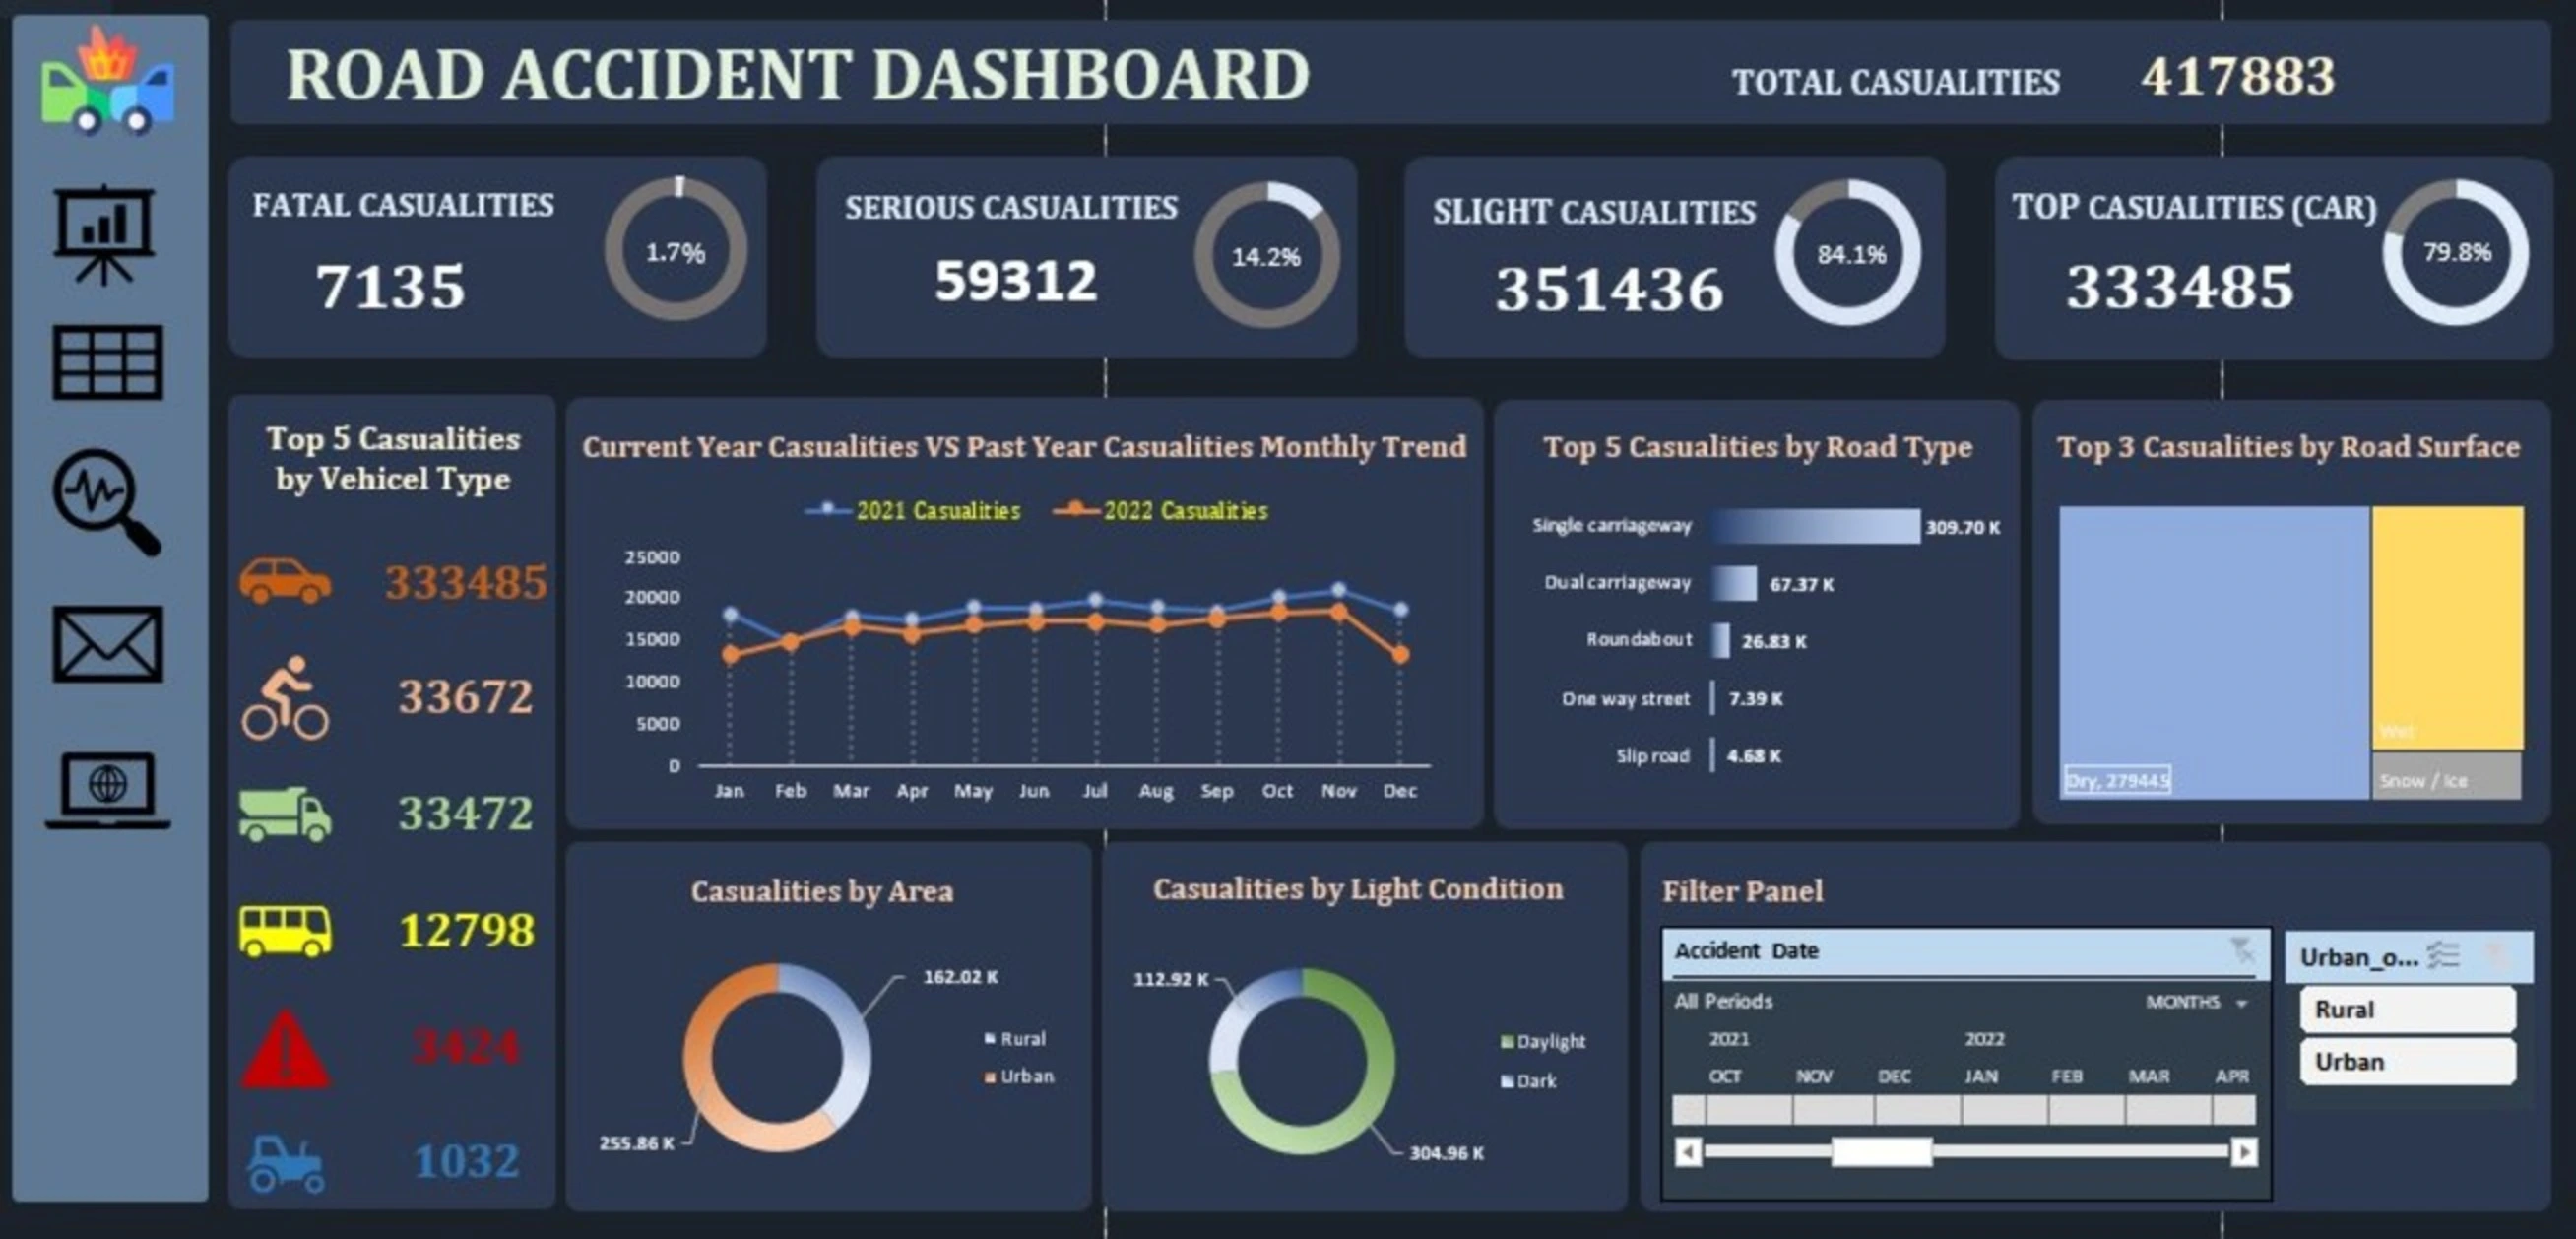
- Total Casualties: 417,883 casualties recorded due to road accidents.
- Vehicle Impact: Cars accounted for the highest casualties (333,485; 79.8%), while other vehicle types accounted for the lowest (3,424).
- Yearly Comparison: 222,146 casualties in 2021 and 195,737 in 2022.
- Monthly Trends: Highest casualties recorded in November 2021 and November 2022; lowest in February 2021 and January 2022.
- Road Type: Single carriageway roads had the highest number of casualties; slip roads had the lowest.
- Surface Condition: Most accidents occurred on dry road surfaces.
Impact
- Provided data-driven insights that can inform traffic management and safety planning.
- Enhanced proficiency in Excel-based data analysis and dashboard development.
- Demonstrated the ability to transform raw data into actionable business intelligence.