POWER BI DASHBOARD
Maven Market Analysis
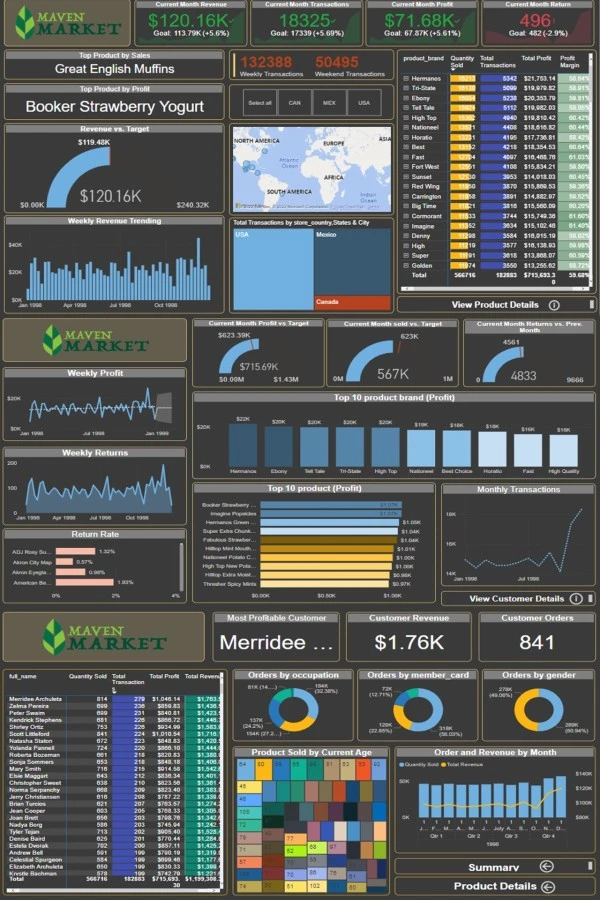
Multi-page business intelligence dashboard analyzing Maven Market sales performance, customer demographics, and product profitability using Power BI and DAX.
Project Overview
Completed a bonus project titled "Maven Market Analysis" as part of the Microsoft Power BI Desktop for Business Intelligence certification. Developed an interactive dashboard to analyze Maven Market datasets, delivering actionable insights on sales performance, product trends, and customer behavior to support data-driven decision-making.
Objectives
- Analyze overall sales performance, profitability, and transaction trends.
- Evaluate product-level performance against revenue and profit targets.
- Understand customer purchasing behavior and demographic patterns.
- Design an interactive, multi-page Power BI dashboard.
My Responsibilities
- Connected to raw datasets and performed data cleaning and transformation using Power Query.
- Designed and developed a robust relational data model.
- Created advanced DAX measures for KPIs including revenue, profit margin, returns, and target comparisons.
- Built a 3-page interactive dashboard with drill-through and filtering capabilities.
Key Insights
- Overall Summary Page: Tracked total sales, profit, transactions, profit margin, and returns; compared weekday vs. weekend performance; monitored revenue against targets; and visualized weekly revenue trends by country, state, and city. Identified top-performing products by sales and profit.
- Product Details Page: Analyzed current month profit vs. target, units sold vs. target, and return rates compared to the previous month. Highlighted monthly transactions, weekly profit, and top 10 brands/products by profitability.
- Customer Details Page: Identified most profitable customers by revenue and orders. Analyzed customer behavior by occupation, gender, and age group. Examined monthly orders and revenue trends segmented by location.
Impact
- Enabled performance tracking across sales, products, and customers through centralized KPI monitoring.
- Improved business visibility into revenue targets, return rates, and demographic trends.
- Strengthened expertise in data modeling, DAX calculations, and business intelligence reporting.