Independent project · Power BI & SQL
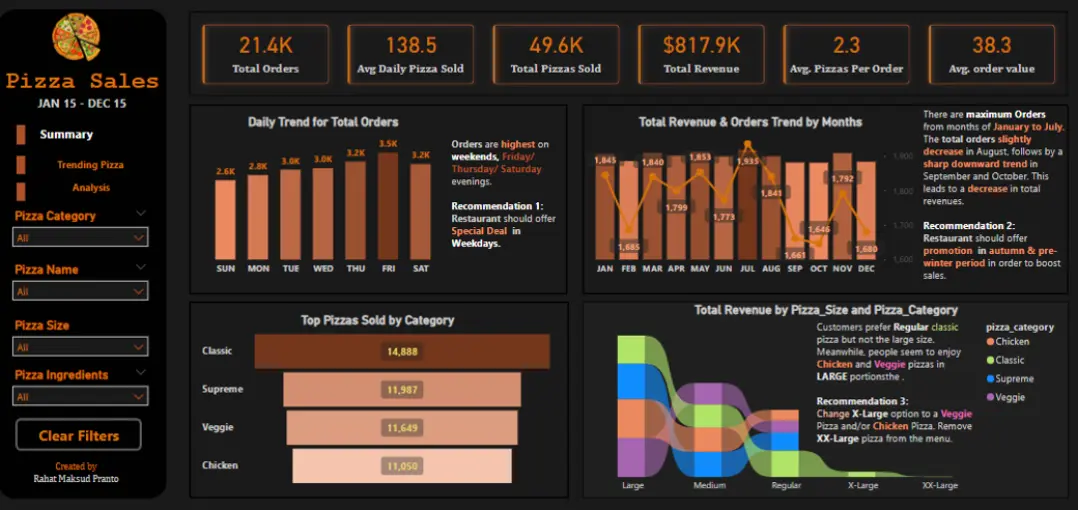
Pizza Sales Analytics
An end-to-end Power BI study of 50,000+ pizza sales records, 15+ KPIs, peak-order periods and menu performance.
Power BI · SQL Server · Power Query
Turning data into clarity
Selected independent analytics and academic projects, with the original public project images, methods and findings.
An end-to-end Power BI study of 50,000+ pizza sales records, 15+ KPIs, peak-order periods and menu performance.
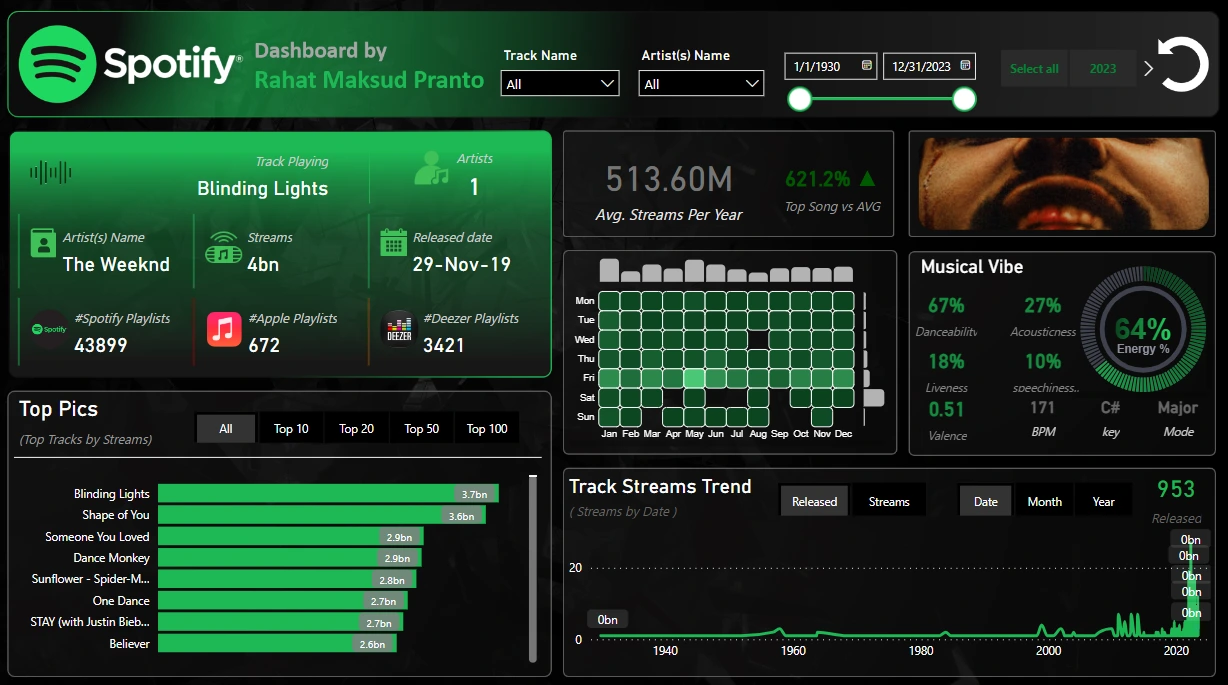
An interactive #DataDNA Power BI report comparing Spotify track rankings with dynamic Top N selections and Deneb visuals.
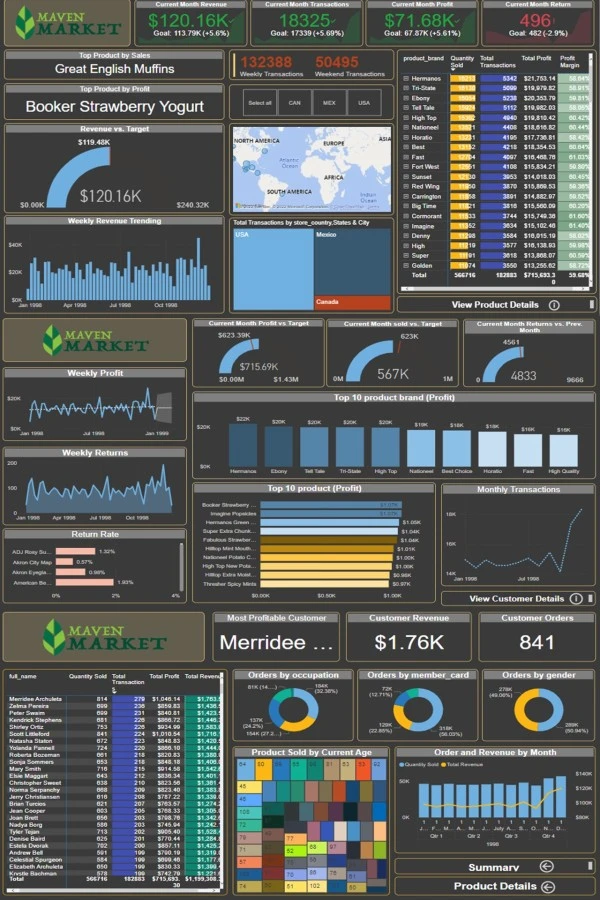
A three-page retail BI report connecting executive sales KPIs with detailed product profitability and customer analysis.
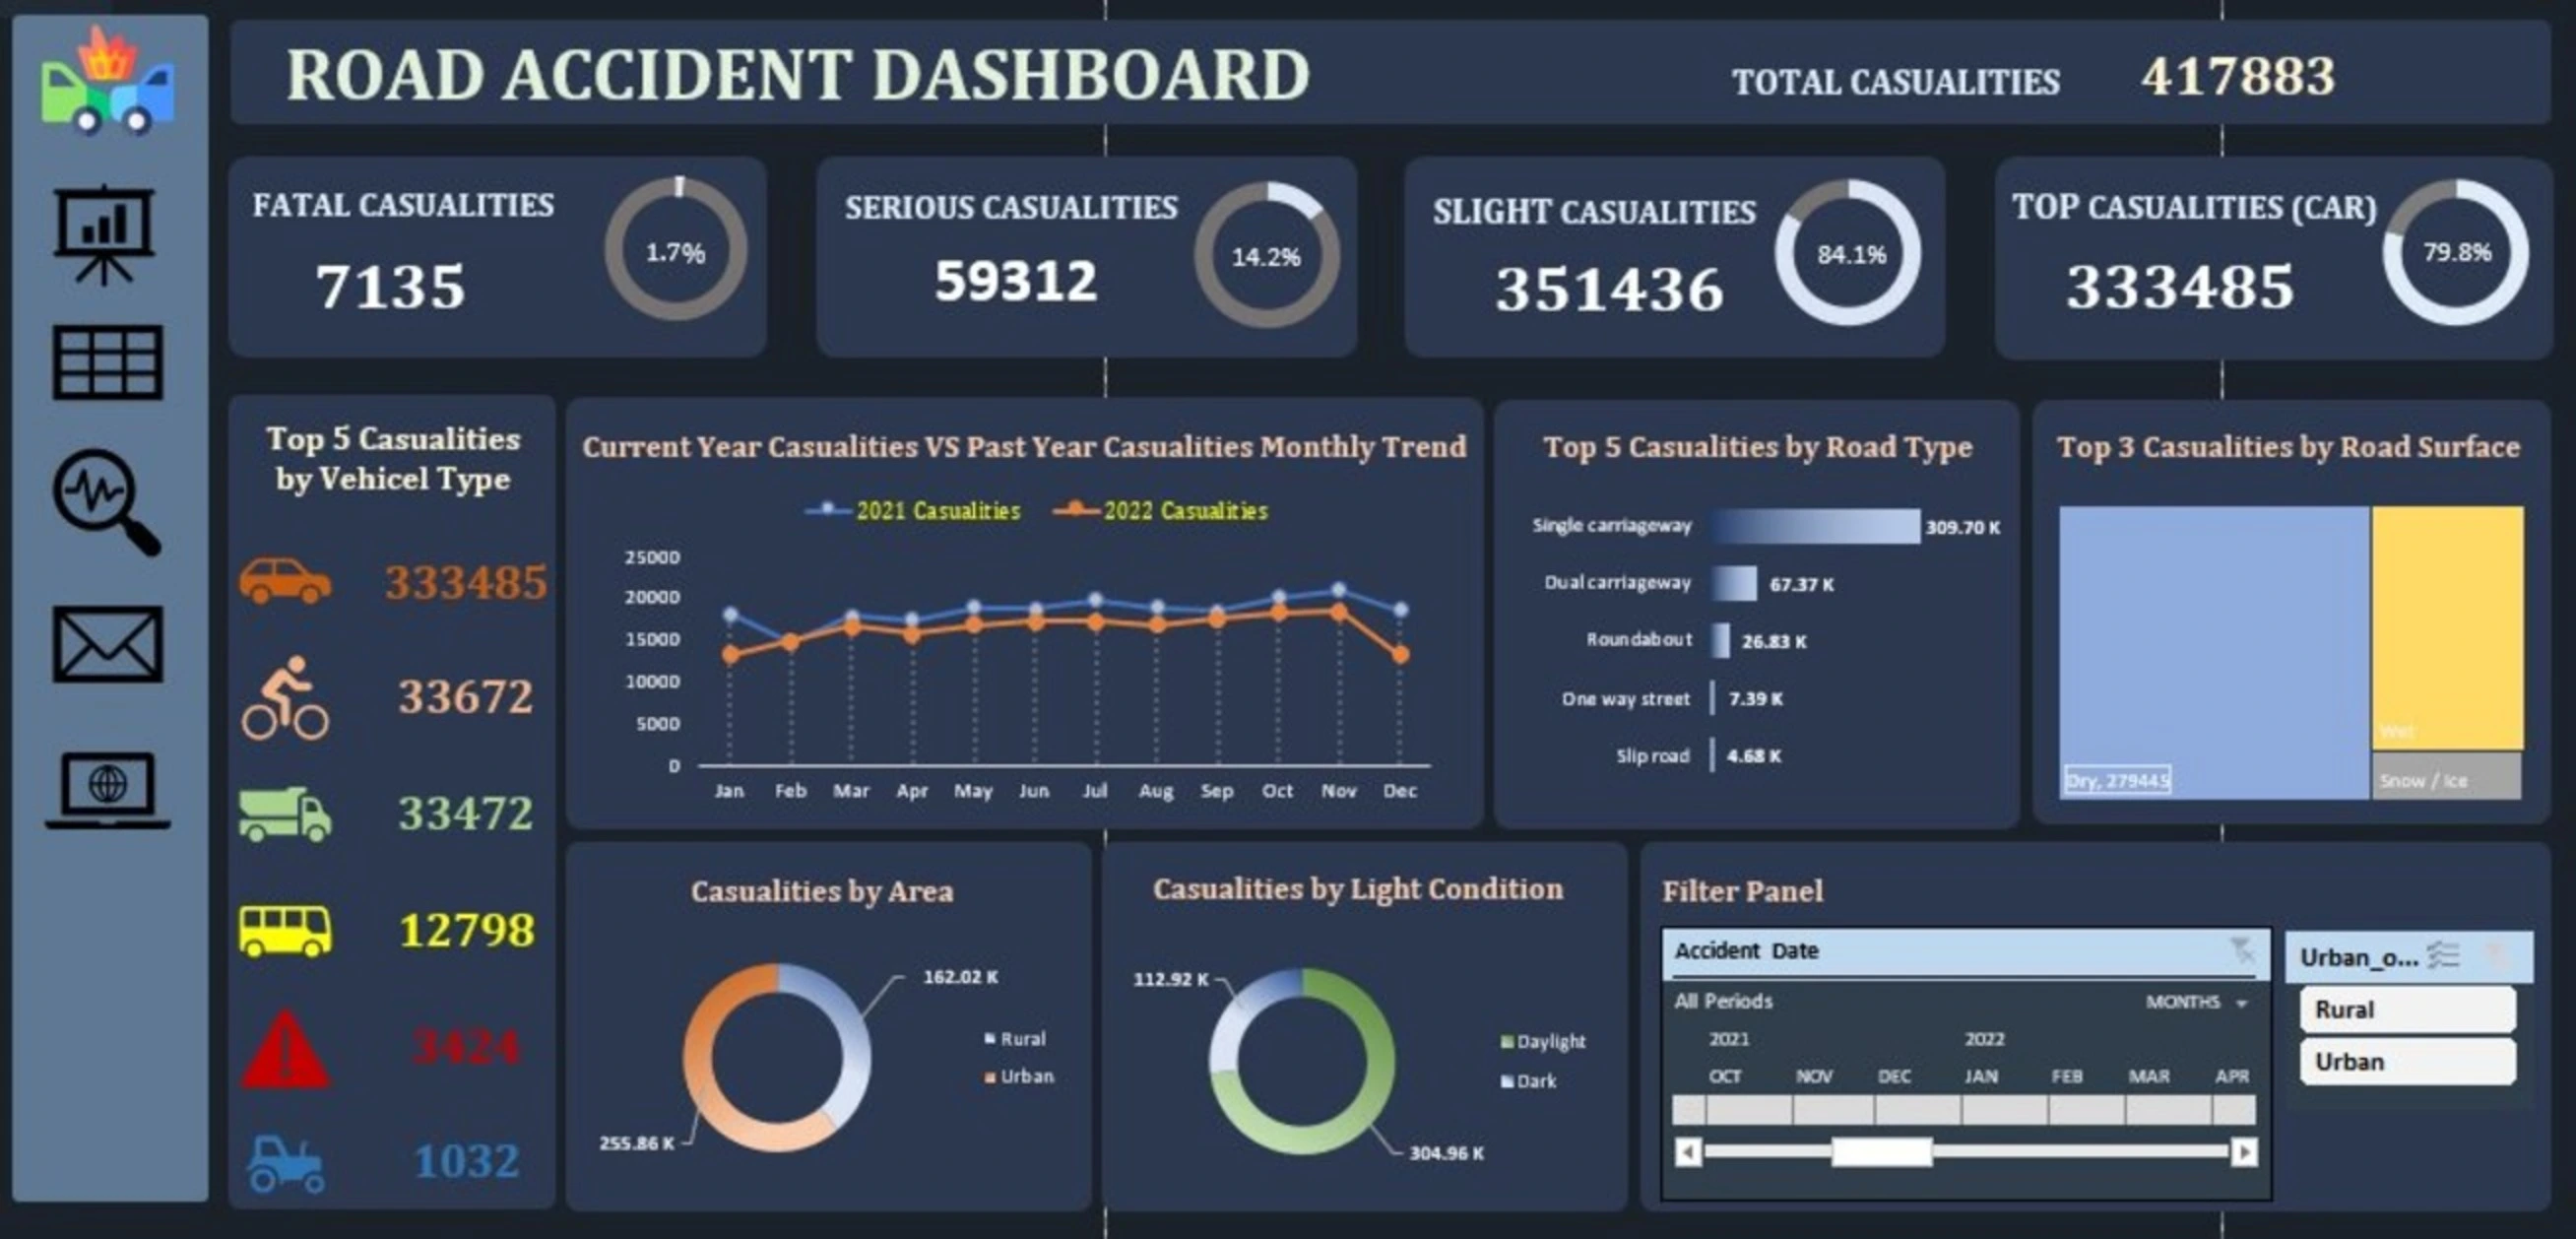
An Excel-only dashboard exploring 2021–2022 accident casualties by vehicle, road condition and month using Pivot Tables and slicers.
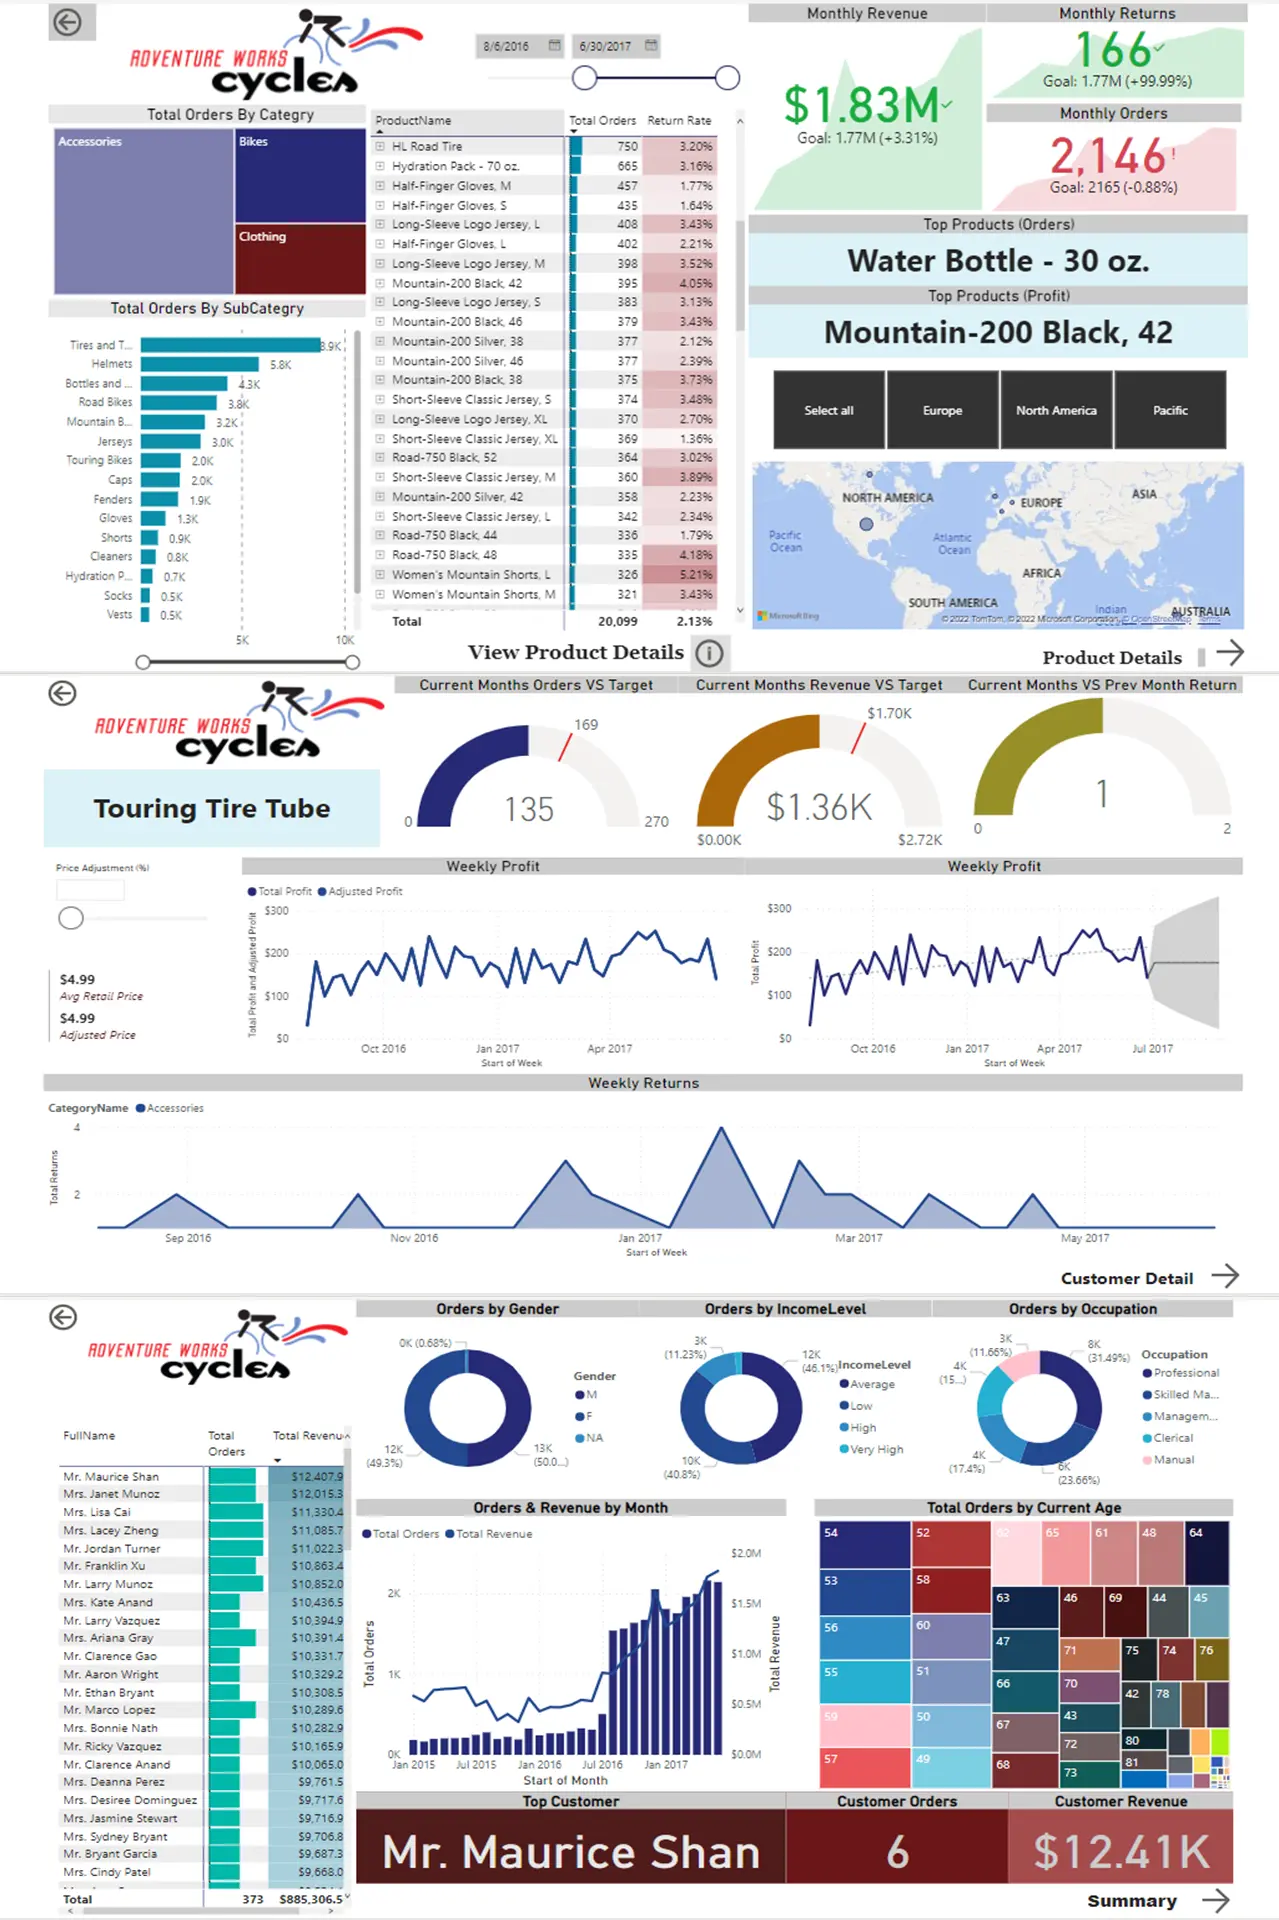
An end-to-end AdventureWorks Cycles Power BI certification project spanning data modeling, DAX, forecasting and sales KPIs.
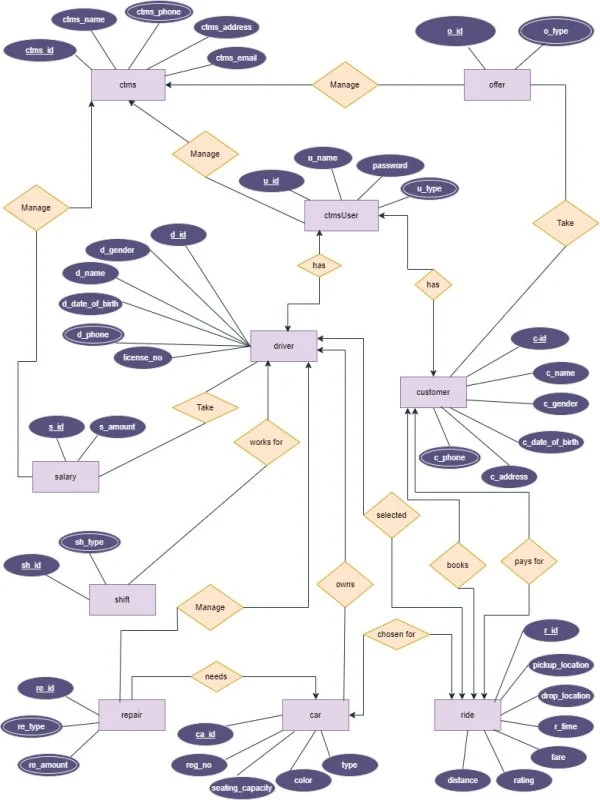
A team-led Oracle database project involving ER modeling, 3NF normalization and 100+ SQL statements for transport operations.
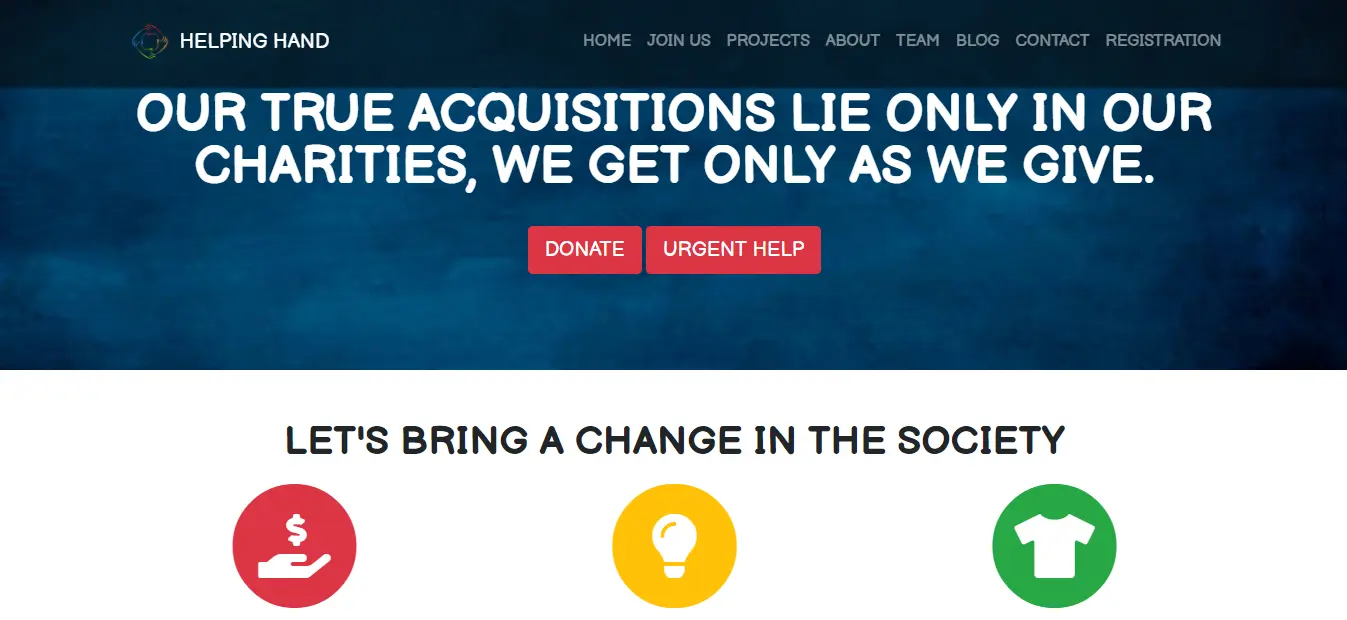
An undergraduate charity-management web project supported by a 51-page SRS, UML/ER modeling and Scrum teamwork.
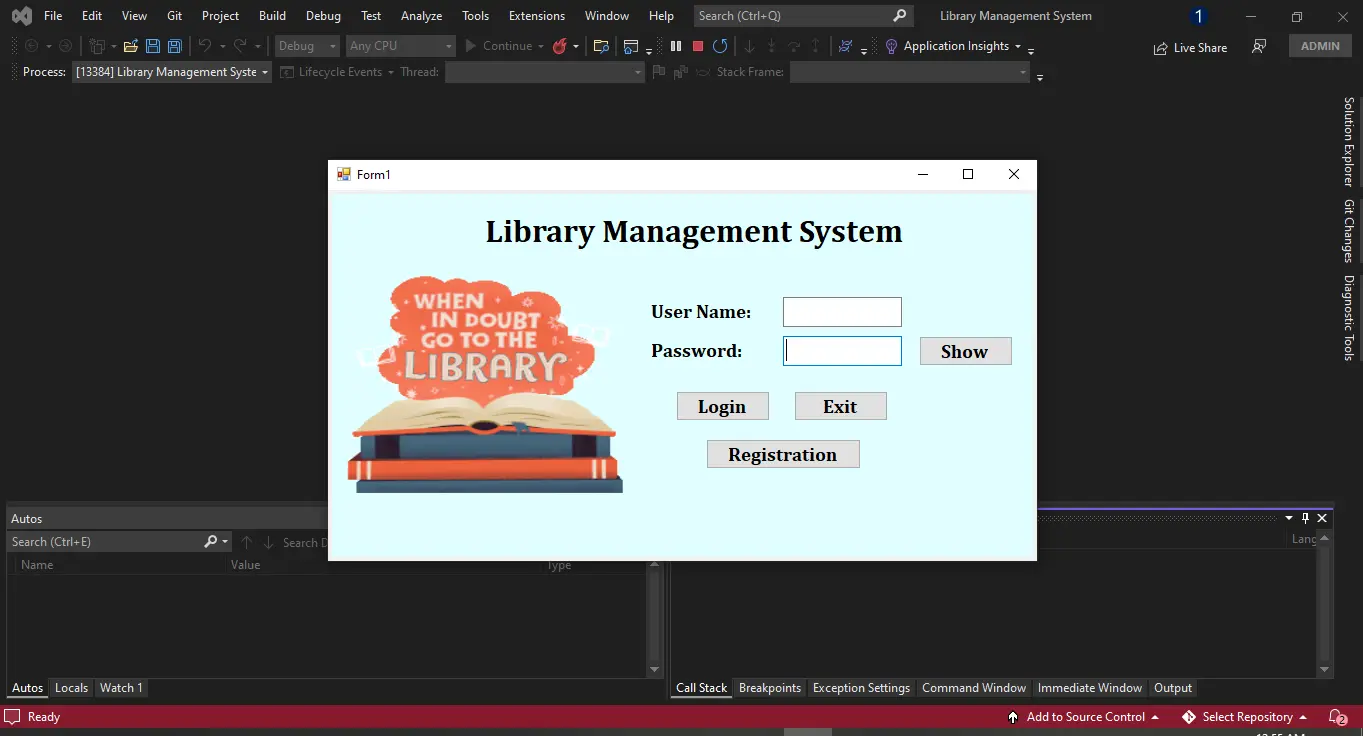
A C# Windows Forms library and bookshop application integrating relational databases and 15+ admin/customer features.