DATA ANALYSIS
Spotify's Most Streamed Tracks Analysis
In-depth data analysis of Spotify's most streamed tracks exploring patterns in music popularity, artist trends, and audio features using Python, Pandas, and visualization libraries.
Project Overview
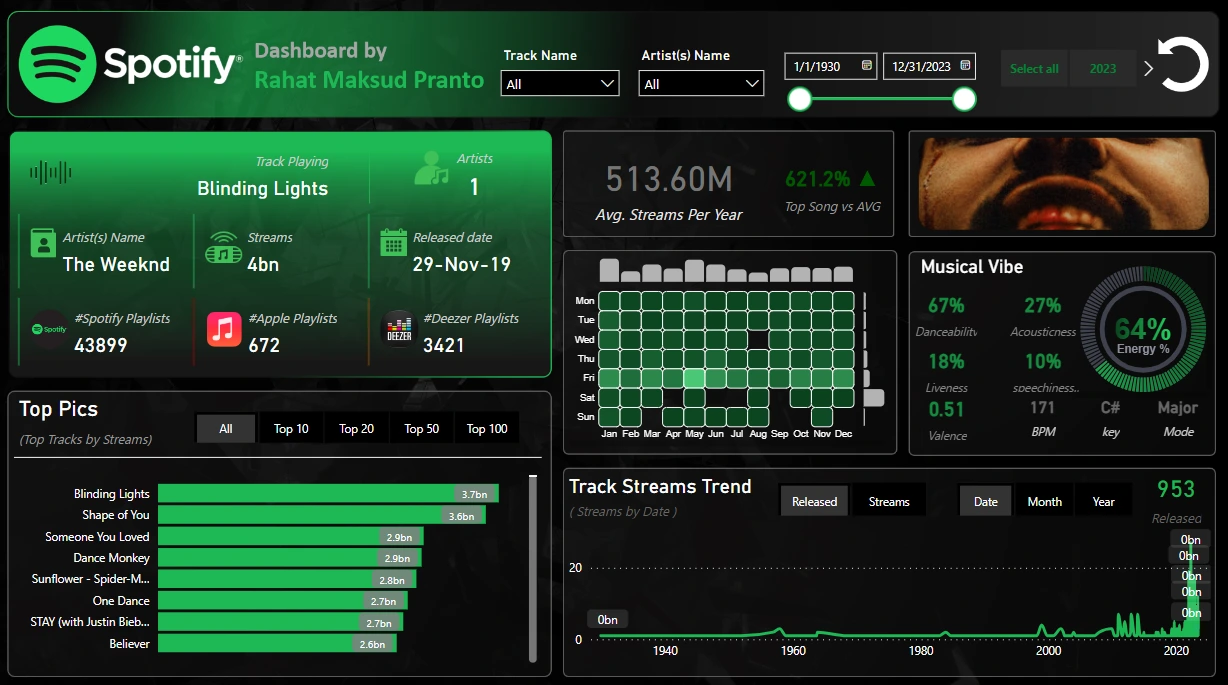
Participated in the October 2023 #DataDNA Dataset Challenge organized by OnyxData, focusing on Spotify’s Most Streamed Tracks of 2023. Developed an interactive dashboard to explore streaming trends across multiple release years, highlight standout tracks, and analyze evolving patterns in the music industry.
Objectives
- Analyze streaming trends across different release years and timeframes.
- Identify standout tracks and dominant streamers.
- Explore musical characteristics and evolving industry patterns.
- Build an interactive and visually engaging dashboard.
My Responsibilities
- Performed data analysis to uncover popularity trends and track performance patterns.
- Implemented a dynamic TopN slicer to identify leading streamed tracks across different periods.
- Developed interactive visualizations using Deneb Heatmap, Deneb Unitchart, and HTML Visual.
- Used HTML to showcase vibrant cover images of the most streamed songs.
- Created dynamic slicer selections with parameters for enhanced user interactivity.
- Designed customized dashboard backgrounds using PowerPoint.
Key Insights
- Identified streaming peaks across different timeframes throughout the year.
- Discovered dominant tracks consistently leading in stream counts.
- Highlighted unique musical vibes and patterns among top-performing songs.
Impact
- Delivered an interactive dashboard enabling deeper analysis of music industry trends.
- Enhanced data storytelling through advanced custom visuals and dynamic filtering.
- Strengthened analytical and visualization skills applicable to real-world BI projects.